Excel Budget Analysis Tutorial: Year-on-Year Government Spending Visualization
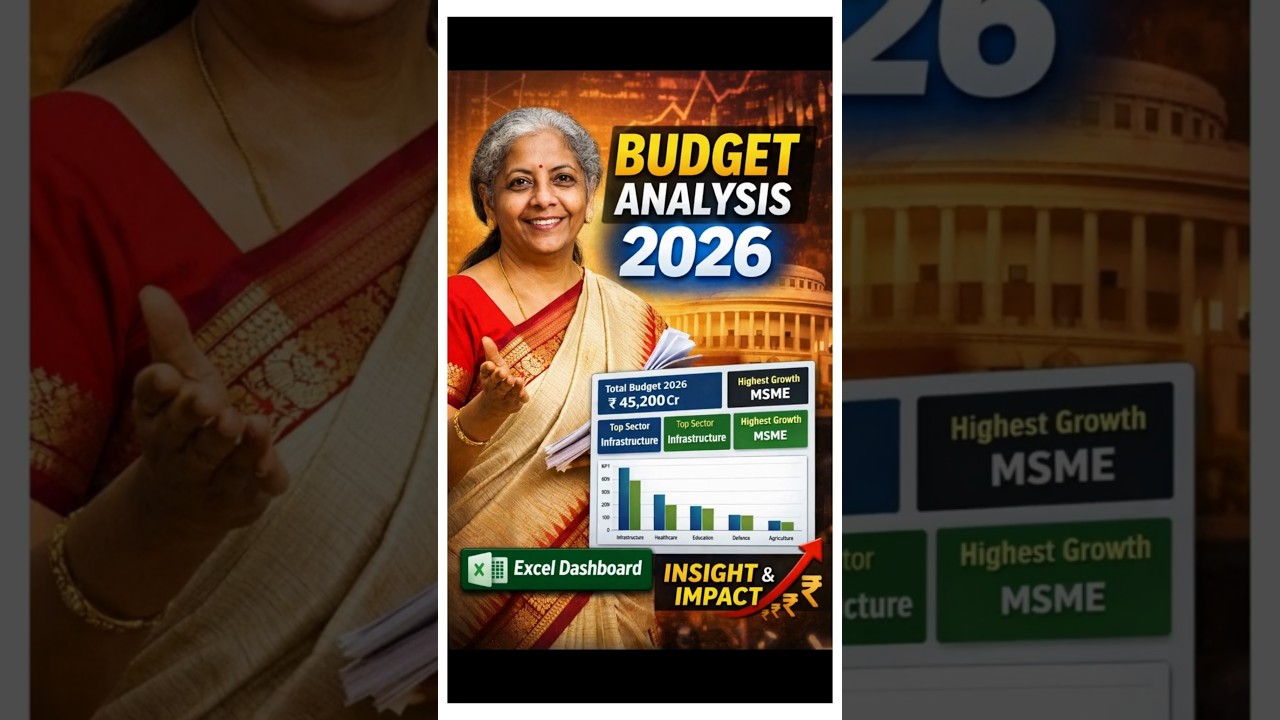
This practical Excel tutorial demonstrates how to analyze government budget allocations across sectors such as infrastructure, health, education, defense, and agriculture. Using real-world budget figures for two consecutive years, the walkthrough explains how to calculate year-on-year percentage changes, visualize trends, and present insights clearly.
You’ll learn how to apply simple Excel formulas to compute budget growth, convert values into percentage formats, and classify changes as high, medium, or low using conditional formatting. The tutorial then progresses to building an effective combo chart that combines stacked columns with a line chart to highlight spending trends.
Finally, the analysis is summarized in a KPI-style format, helping decision-makers quickly identify maximum spending shifts from the previous year to the current year. This method is especially useful for finance professionals, analysts, students, and anyone involved in budget tracking or reporting.